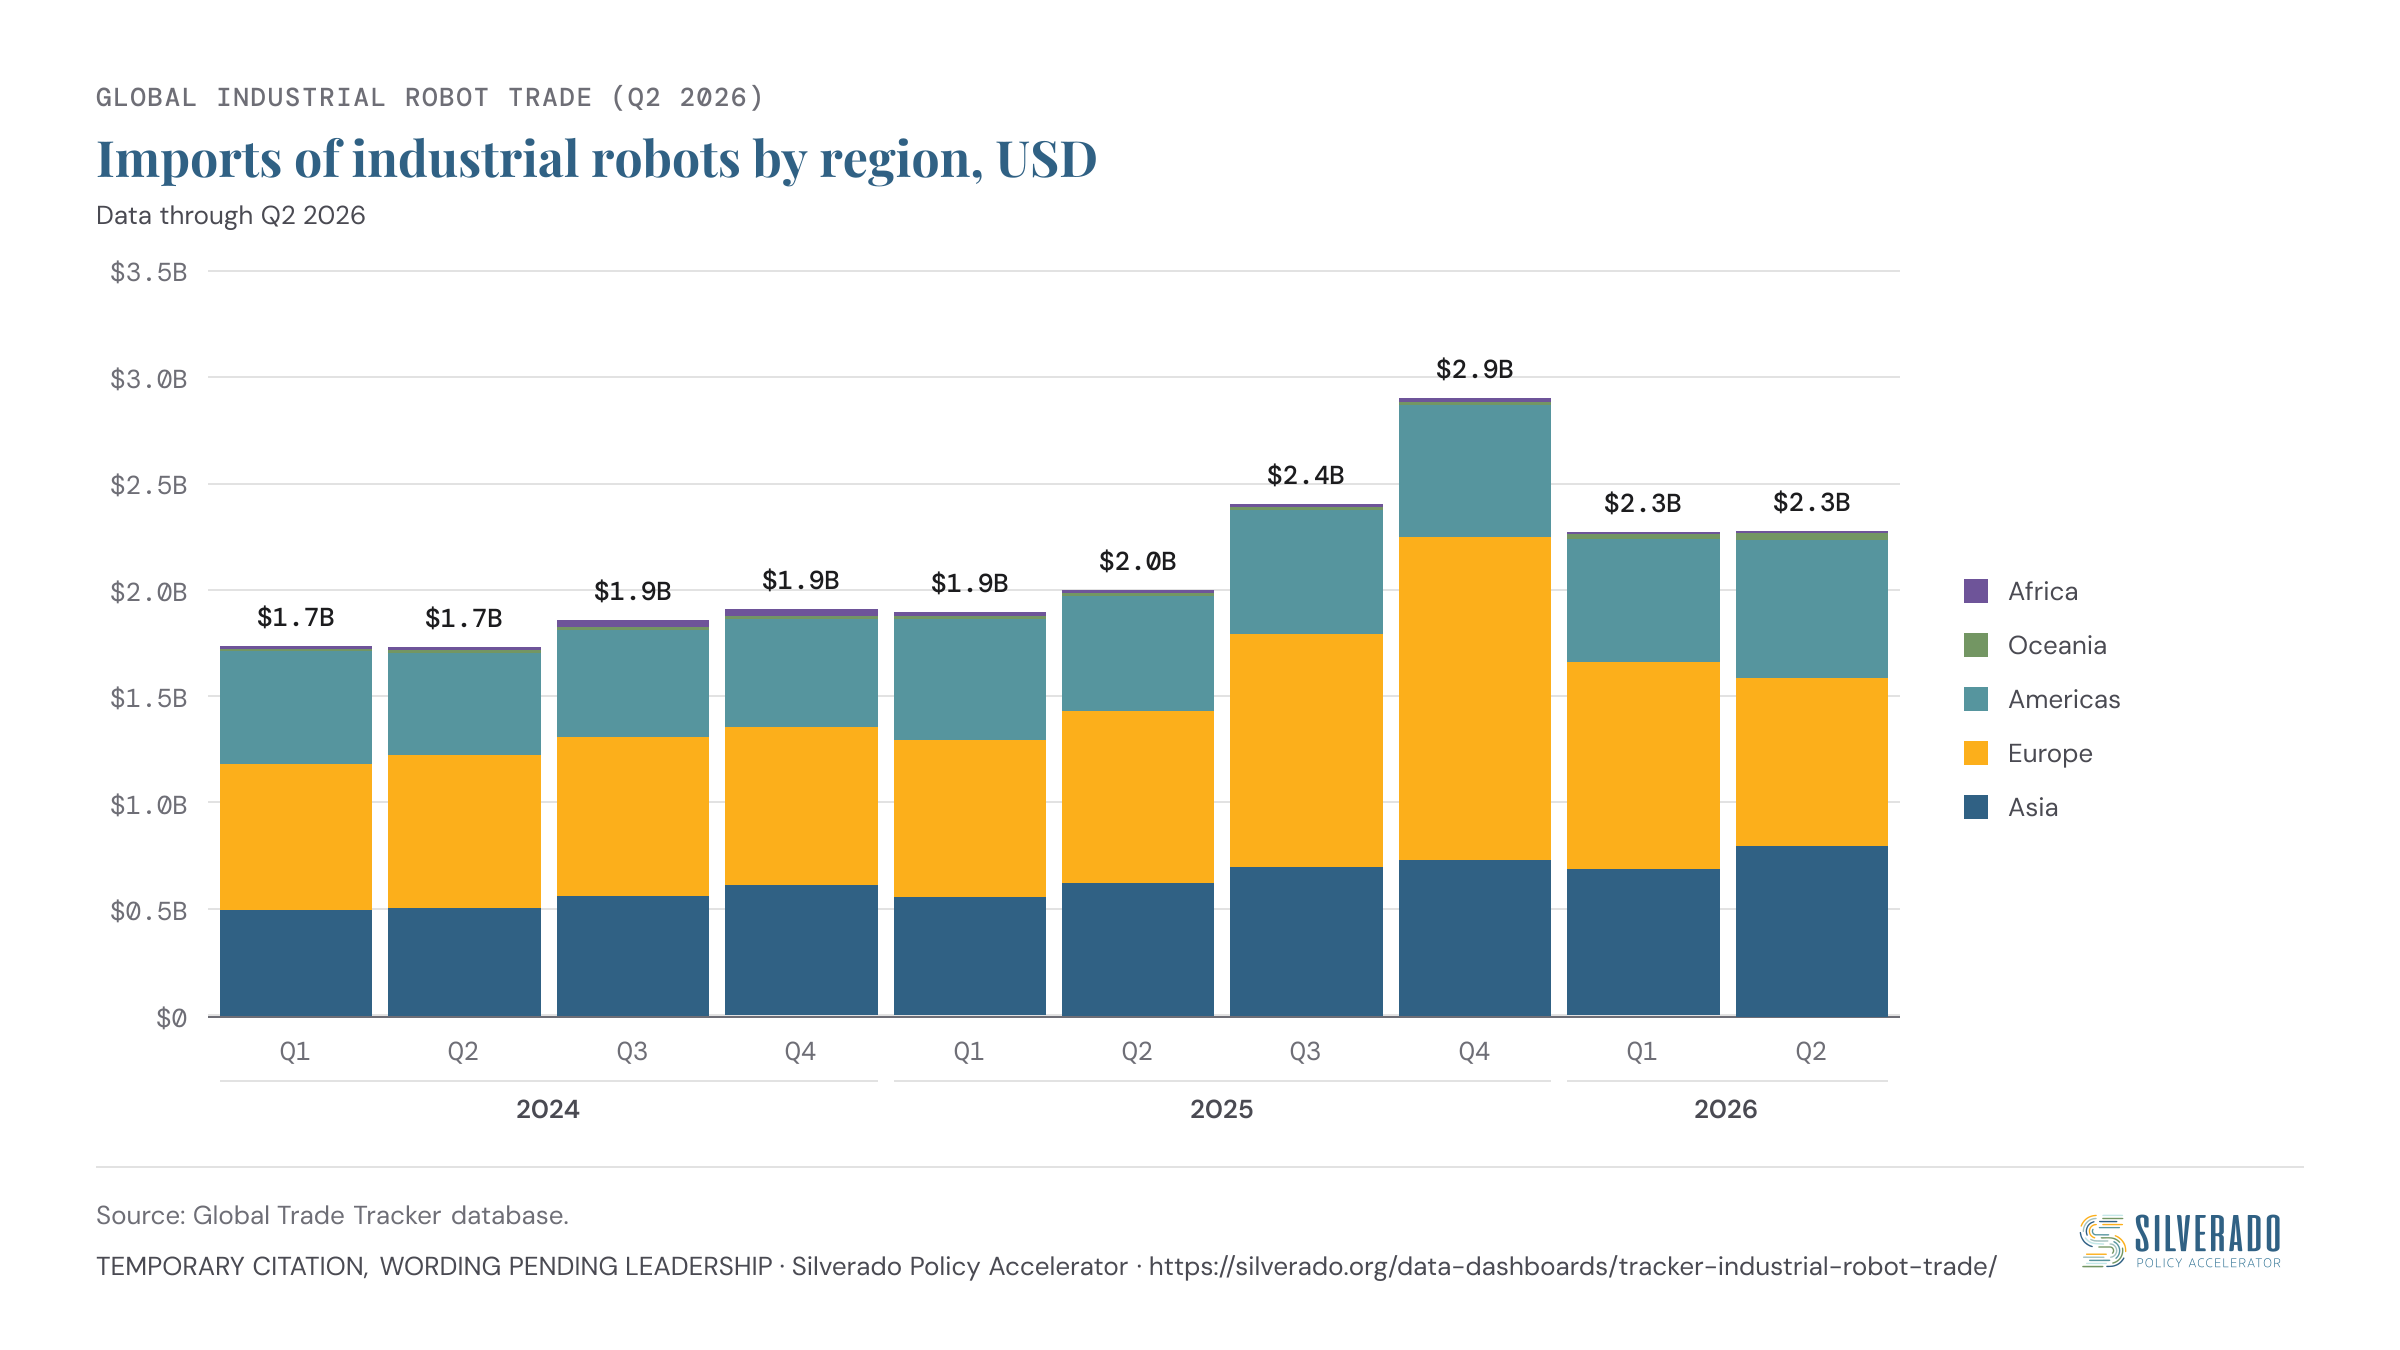
Asia overtook Europe as the largest importer of industrial robots in Q2 2026, reflecting an increase in Asian imports and lower European imports.
Imports of industrial robots by region, USD
Q2 2026
$2.3B
+14.0% vs Q2 2025+0.4% vs Q1 2026
Use the arrows or tap a bar to change the quarter.
$0$0.5B$1.0B$1.5B$2.0B$2.5B$3.0B$3.5B
$2.3B
Q1
Q2
Q3
Q4
Q1
Q2
Q3
Q4
Q1
Q2
2024
2025
2026
Imports of industrial robots by region, USD
Quarter
Grand Total
vs prior quarter
vs prior year
Q2 2026
$2,284M
+0.4%
+14.0%
Q1 2026
$2,275M
−21.8%
+19.8%
Q4 2025
$2,909M
+20.7%
+52.0%
Q3 2025
$2,410M
+20.3%
+29.4%
Q2 2025
$2,004M
+5.5%
+15.4%
Q1 2025
$1,898M
−0.8%
+9.1%
Q4 2024
$1,914M
+2.8%
—
Q3 2024
$1,862M
+7.3%
—
Q2 2024
$1,736M
−0.2%
—
Q1 2024
$1,740M
—
—
The top individual country importers in Q2 2026 were the United States (20 percent of imports), followed by China (12 percent), Luxembourg (7 percent), and Germany (5 percent).
Notes/Sources: The chart on imports by region includes intraregional trade. Global Trade Tracker database.
China trade
Takeaway 3
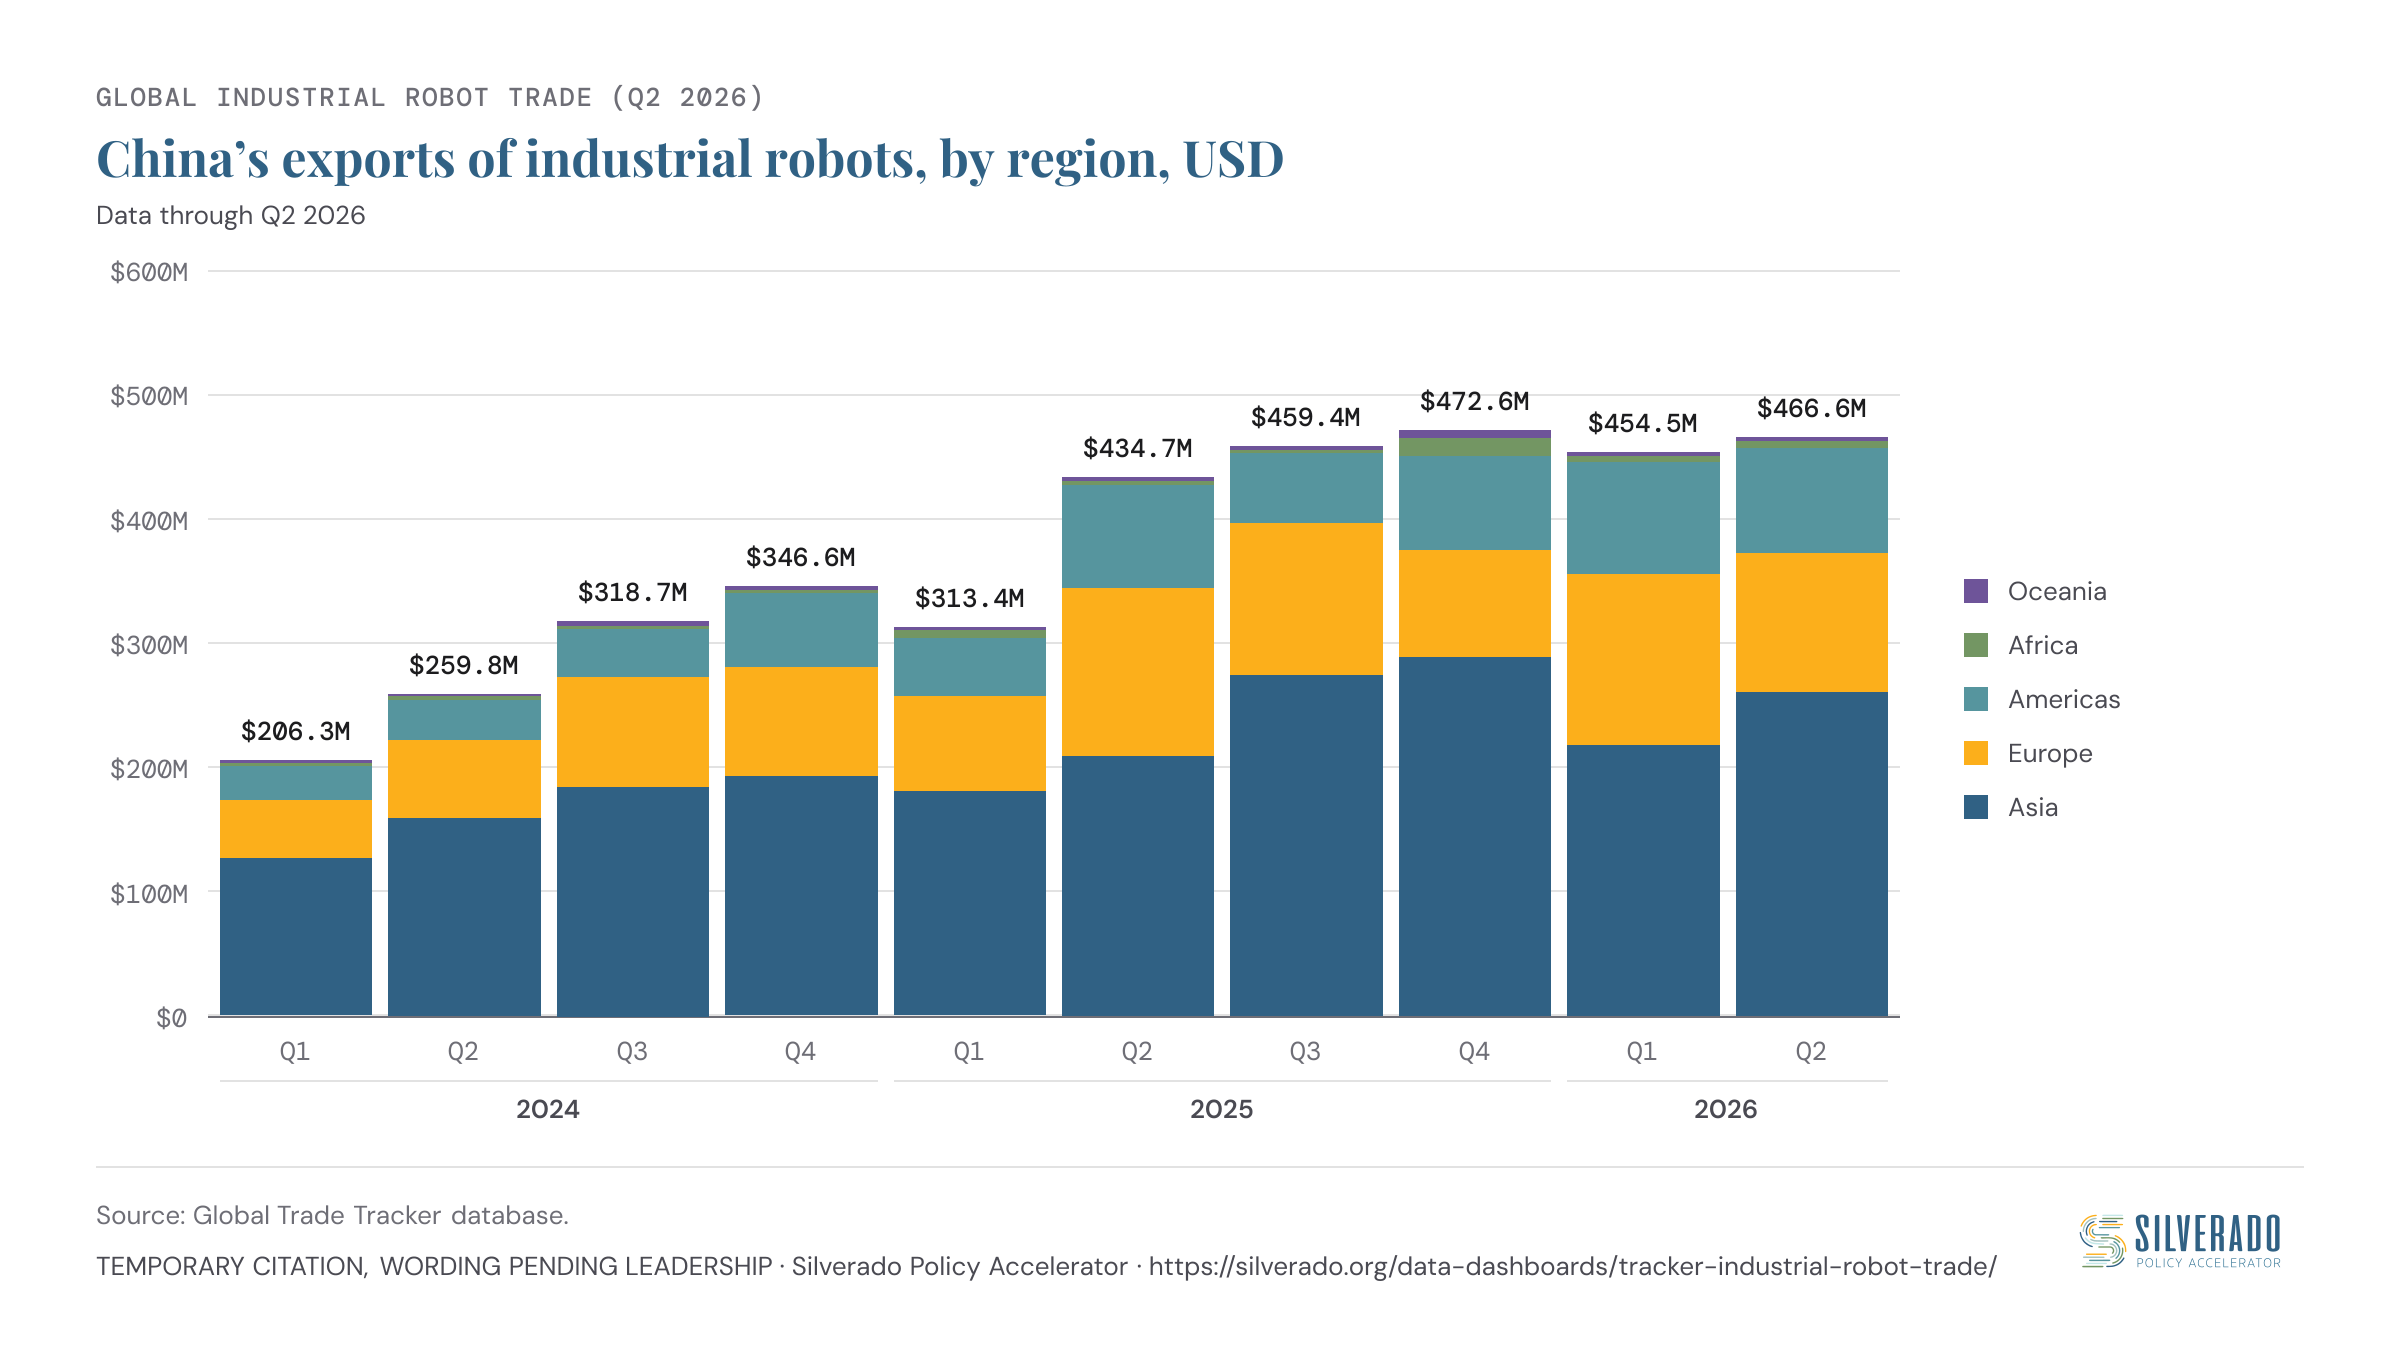
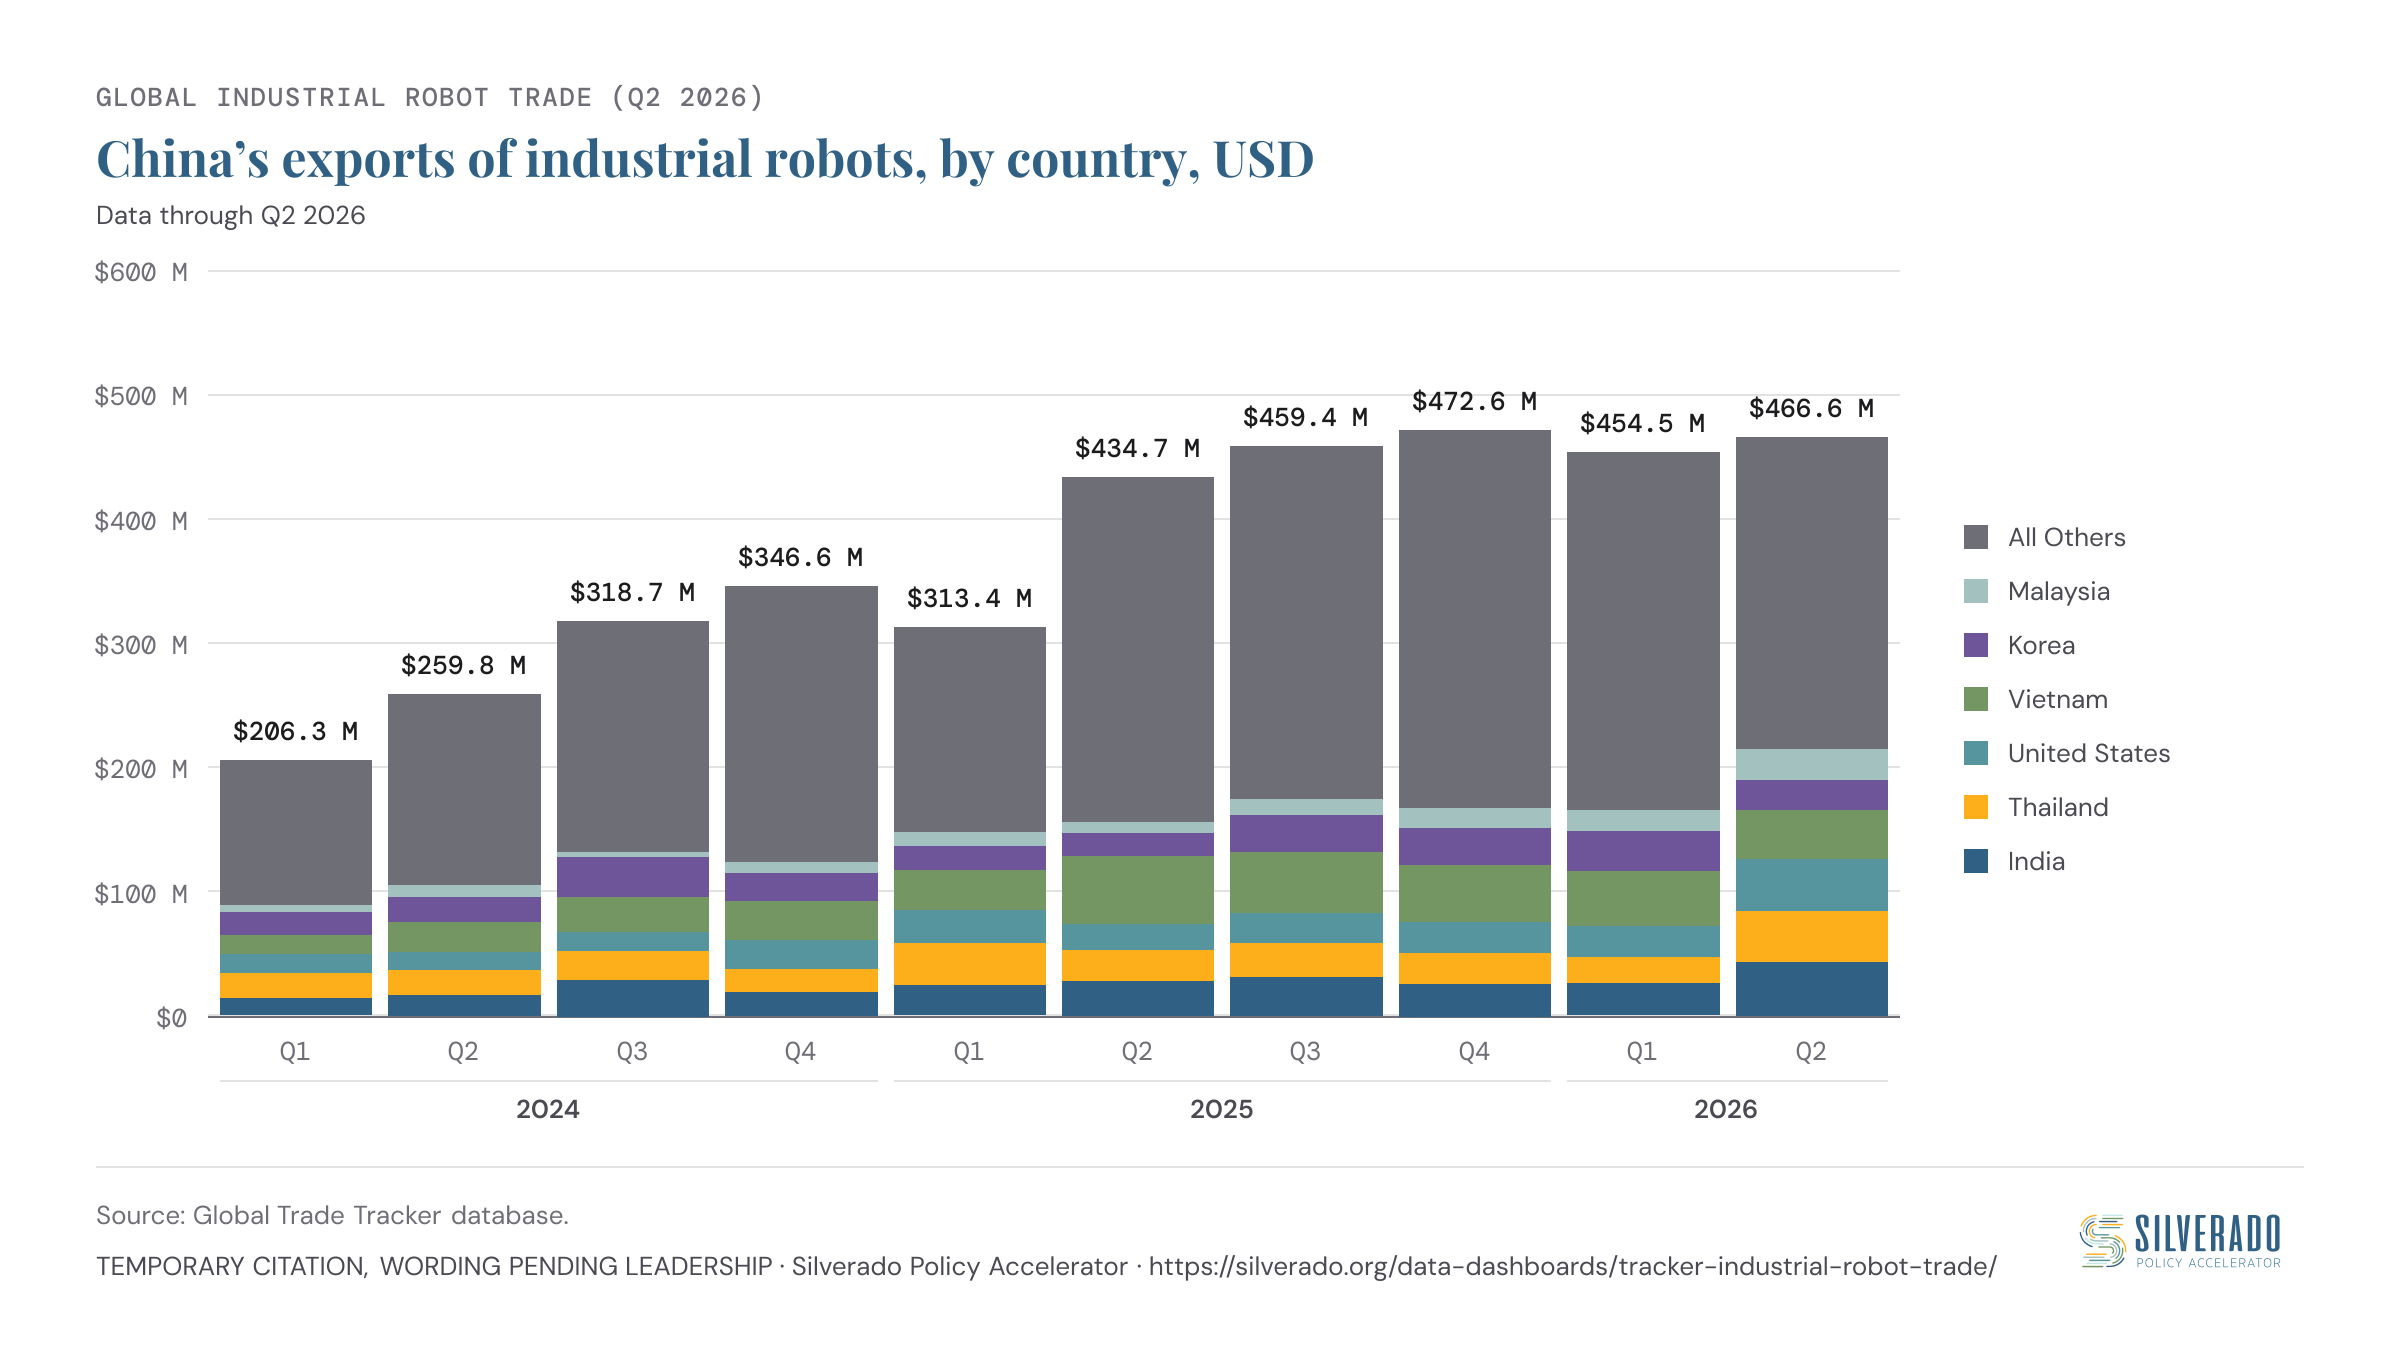
China’s exports were at their second highest quarterly level ever in Q2 2026, and the highest ever Q2 level. Regionally, Asia was China’s largest export destination.
China’s exports of industrial robots, by region, USD
Q2 2026
$466.6M
+7.3% vs Q2 2025+2.7% vs Q1 2026
Use the arrows or tap a bar to change the quarter.
$0$100M$200M$300M$400M$500M$600M
$466.6M
Q1
Q2
Q3
Q4
Q1
Q2
Q3
Q4
Q1
Q2
2024
2025
2026
China’s exports of industrial robots, by region, USD
Notes/Sources: China has additional breakouts in its tariff schedule for industrial robots. The data in this section include the additional breakouts and are slightly broader than the global data above, which use the narrower categories for consistency. Global Trade Tracker database.
U.S. trade
Takeaway 5
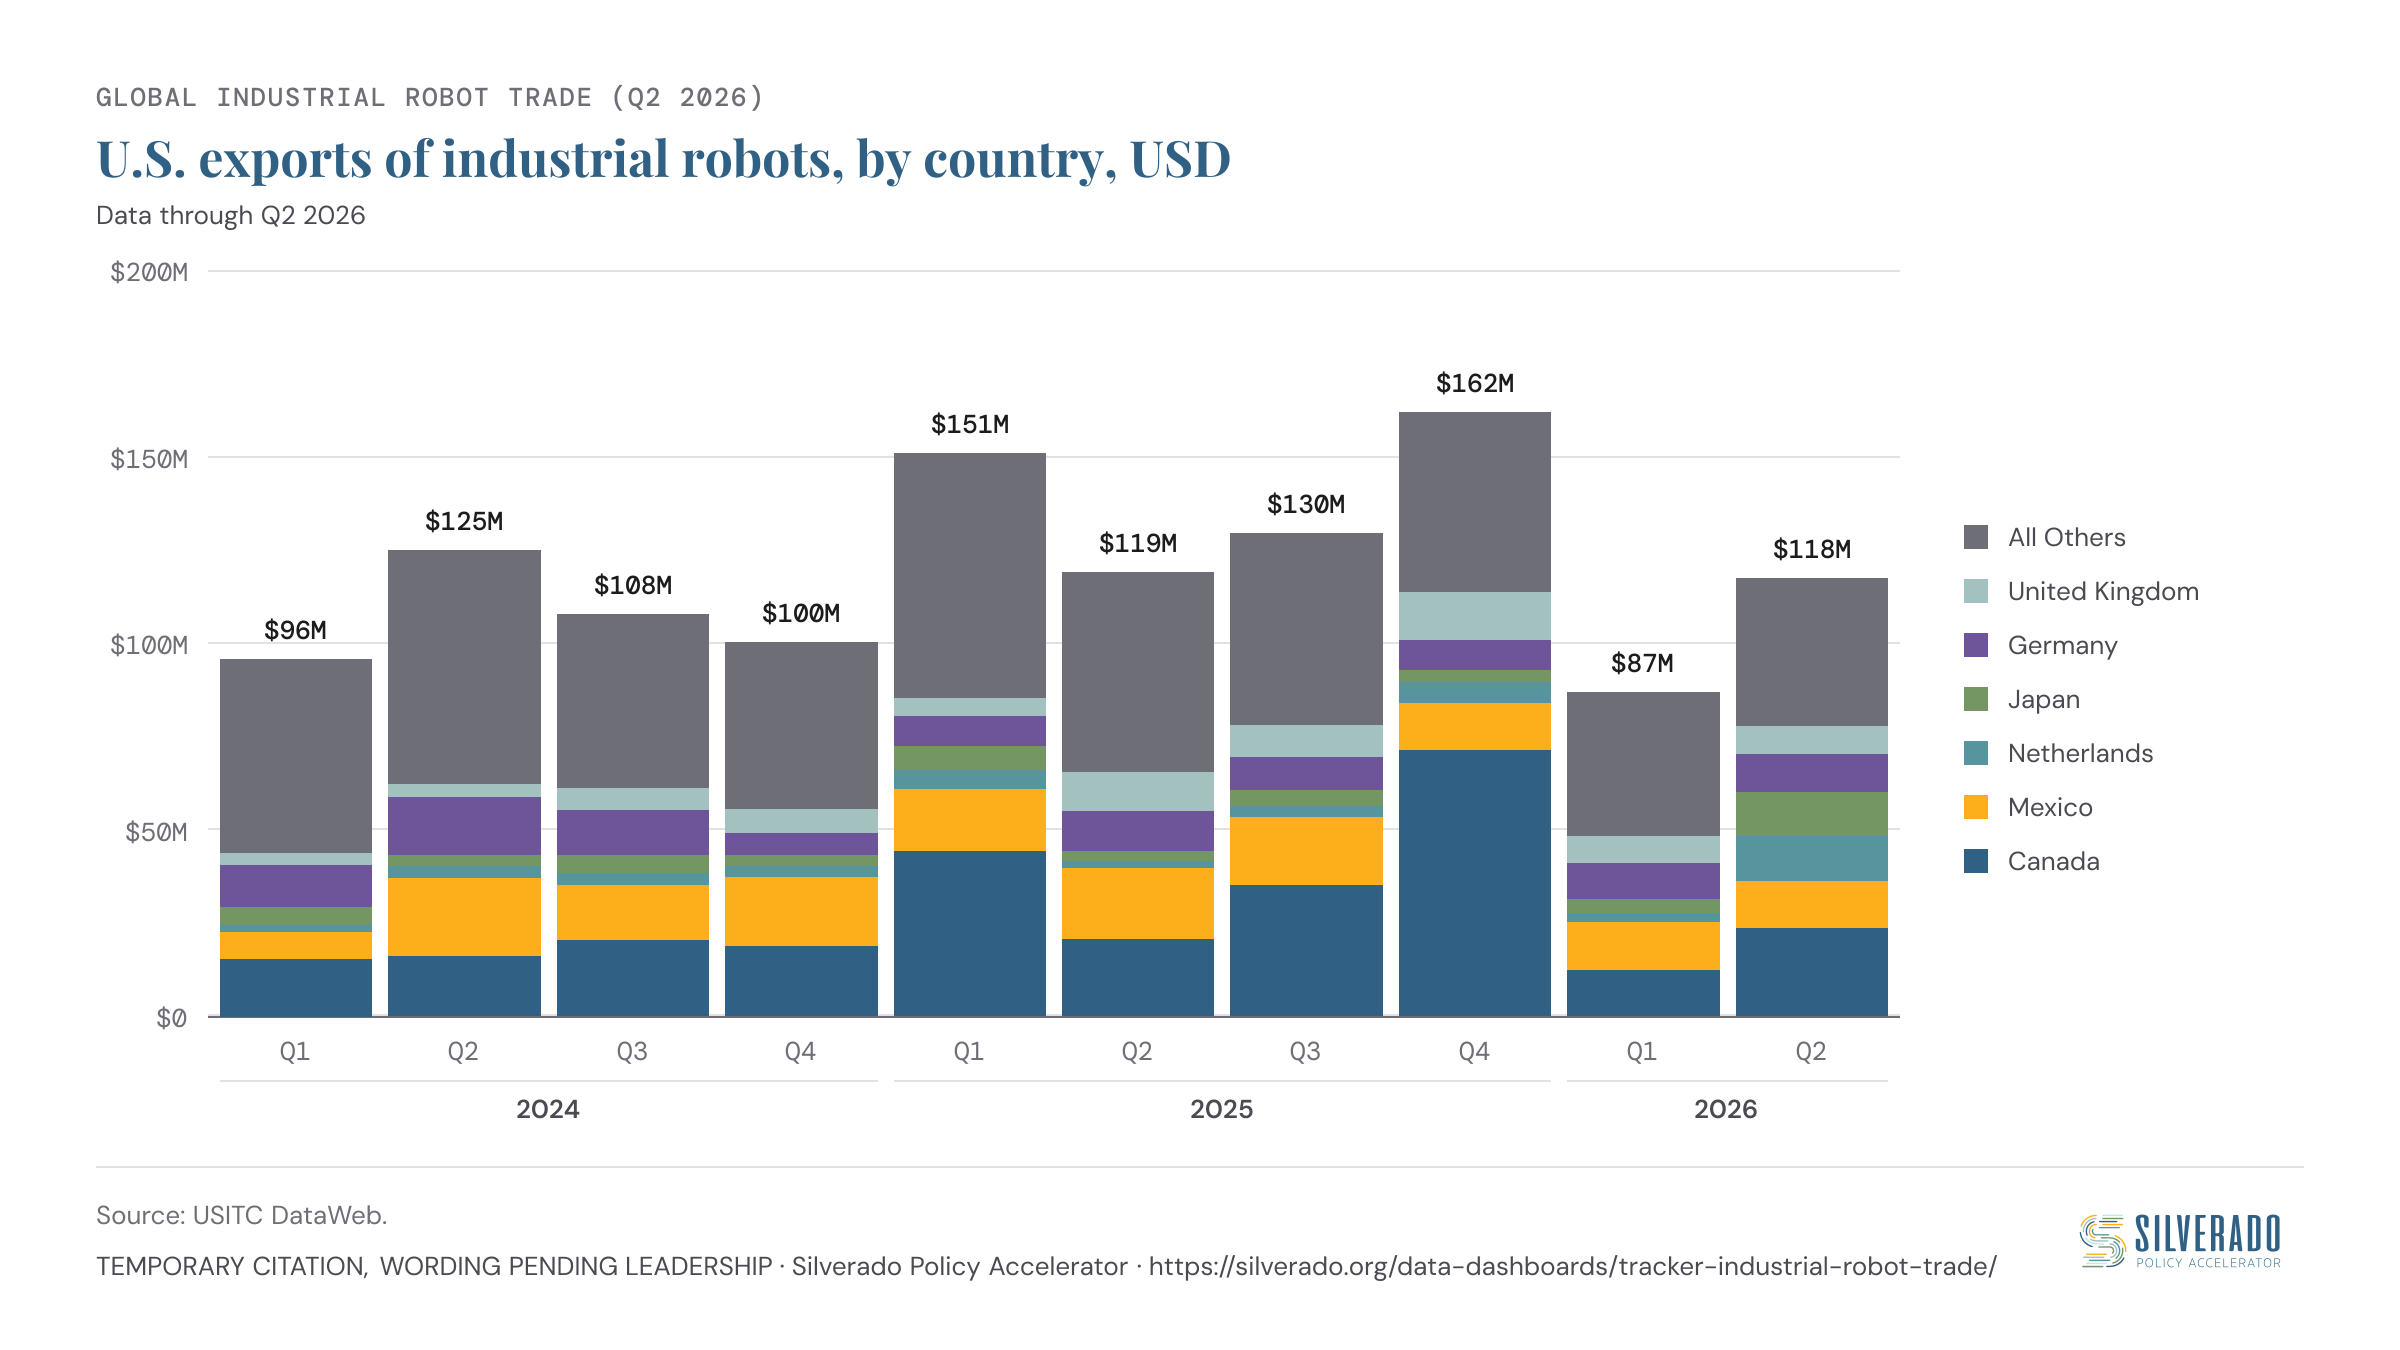
U.S. exports of industrial robots rebounded from low Q1 2026 levels. Canada and Mexico were the largest export destinations.
U.S. exports of industrial robots, by country, USD
Q2 2026
$118M
−1.4% vs Q2 2025+35.2% vs Q1 2026
Use the arrows or tap a bar to change the quarter.
$0$50M$100M$150M$200M
$118M
Q1
Q2
Q3
Q4
Q1
Q2
Q3
Q4
Q1
Q2
2024
2025
2026
U.S. exports of industrial robots, by country, USD
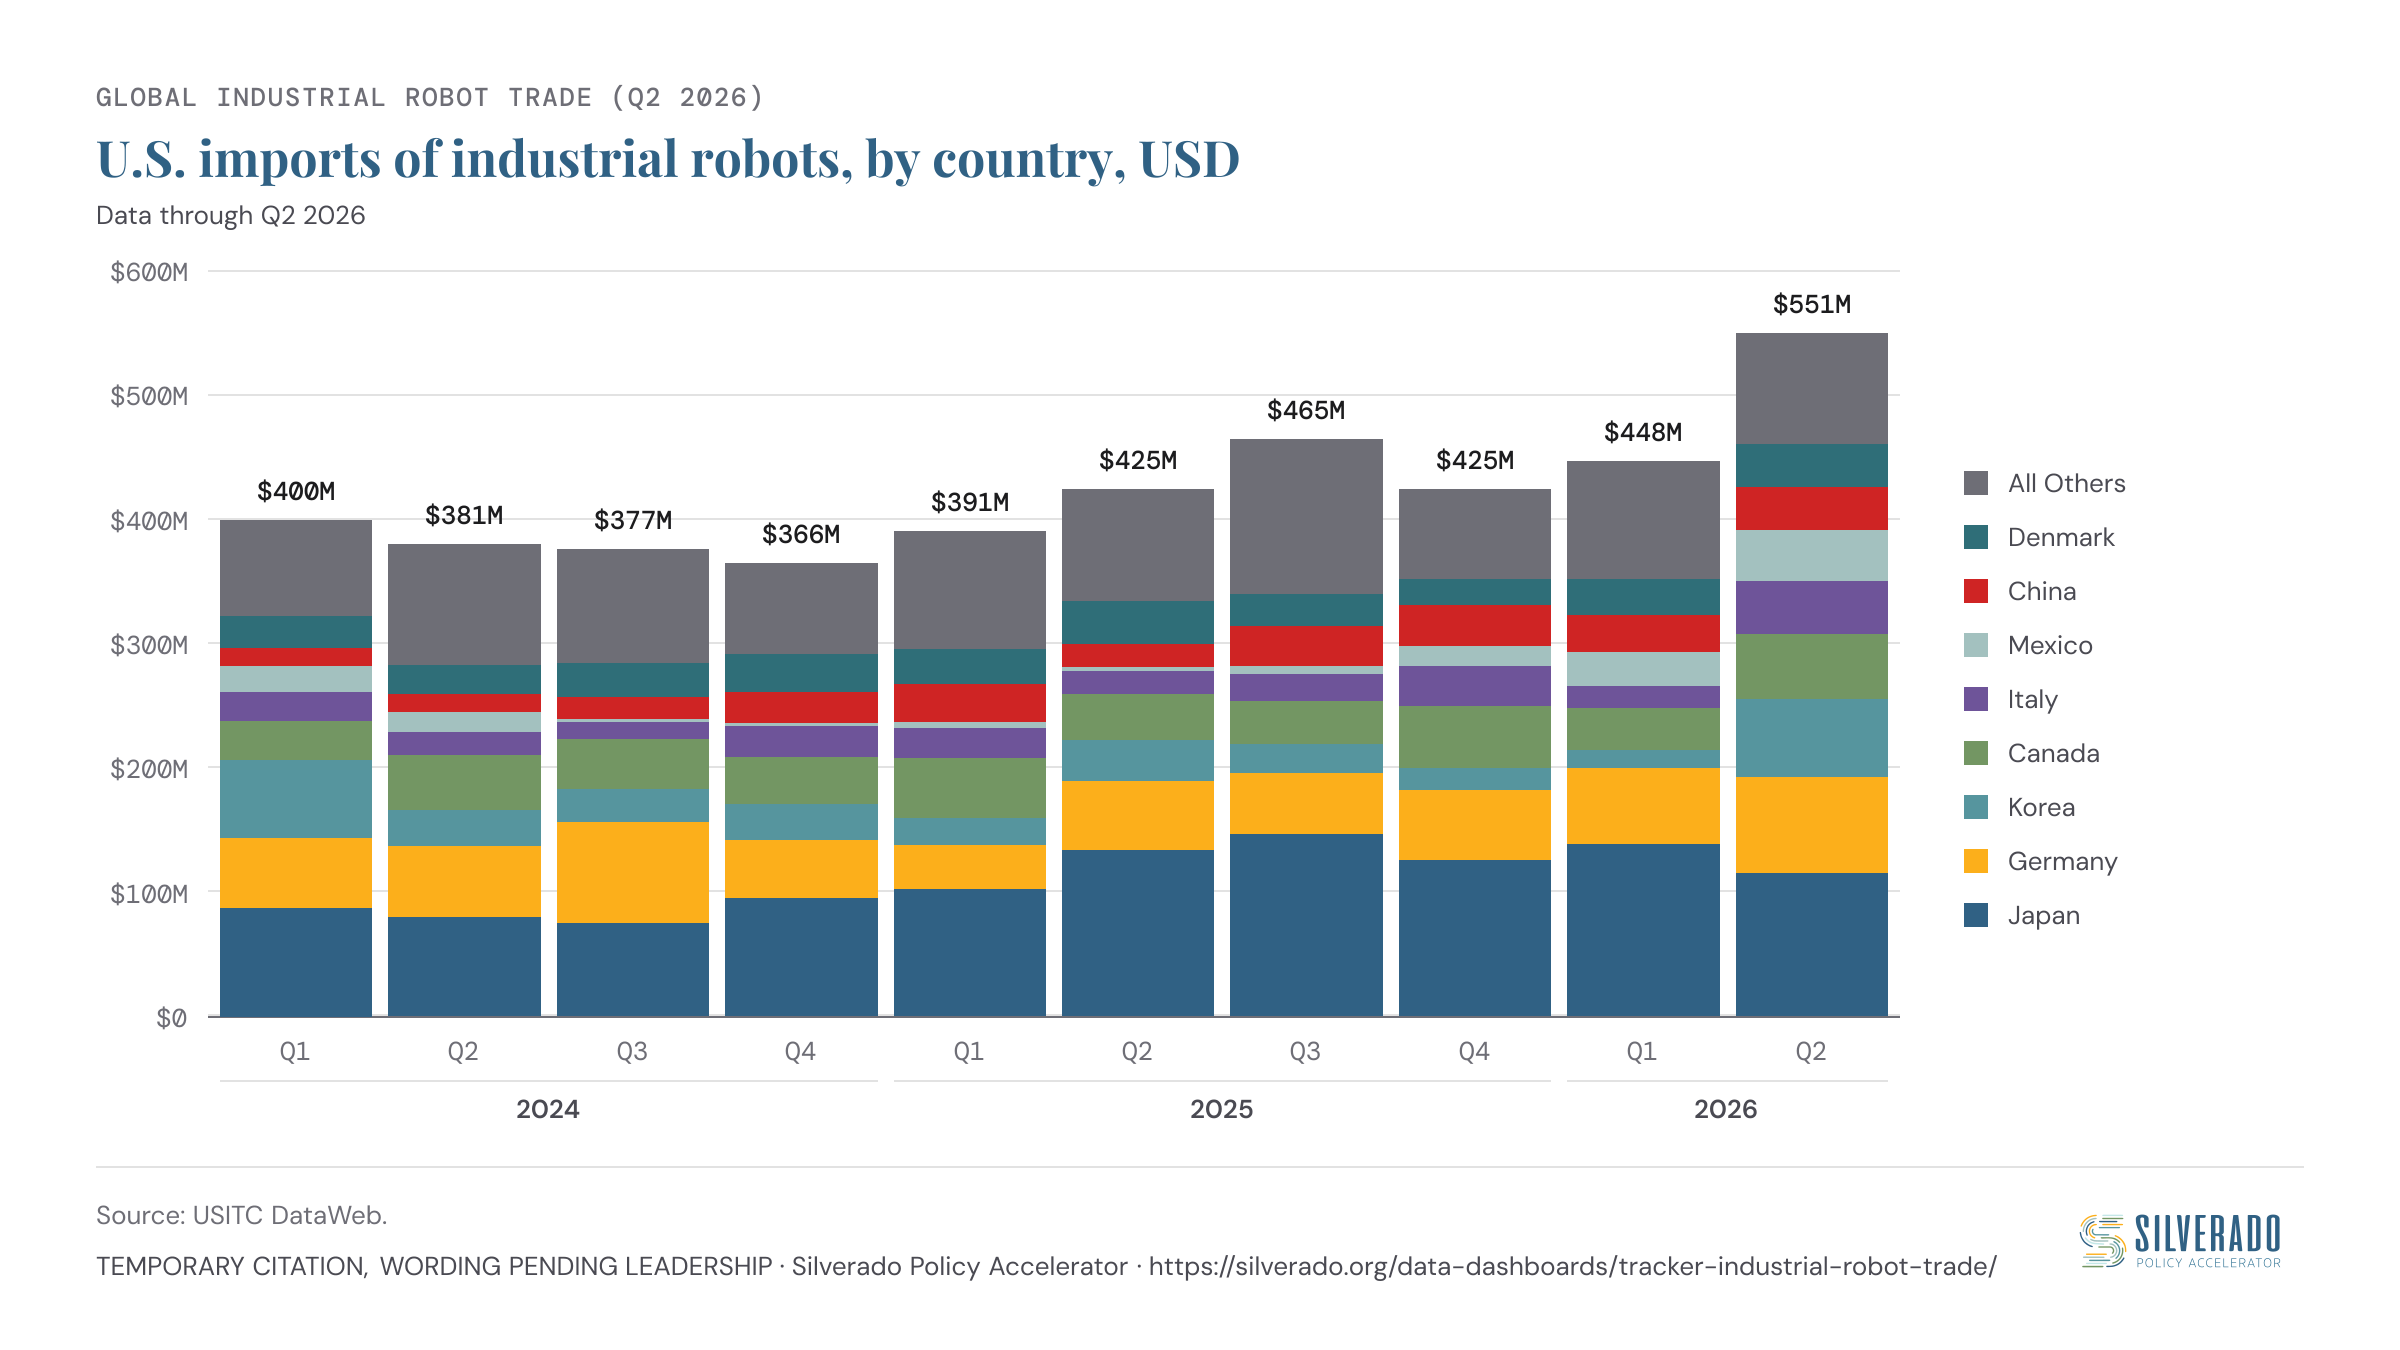
Notes/Sources: U.S. import data include parts of certain types of industrial robots and, therefore, are slightly broader than the global export data above, which do not include parts. USITC DataWeb.
 World on the Brink